.png?1747673074781)


.png?1747673074781)
.png?1747673074781)

.png?1747673074781)


Burnup Chart
Now you can view estimated time when a project will be completed.
-
評価
-
インストール数5000
-
開発者Bitrix24 Integrations

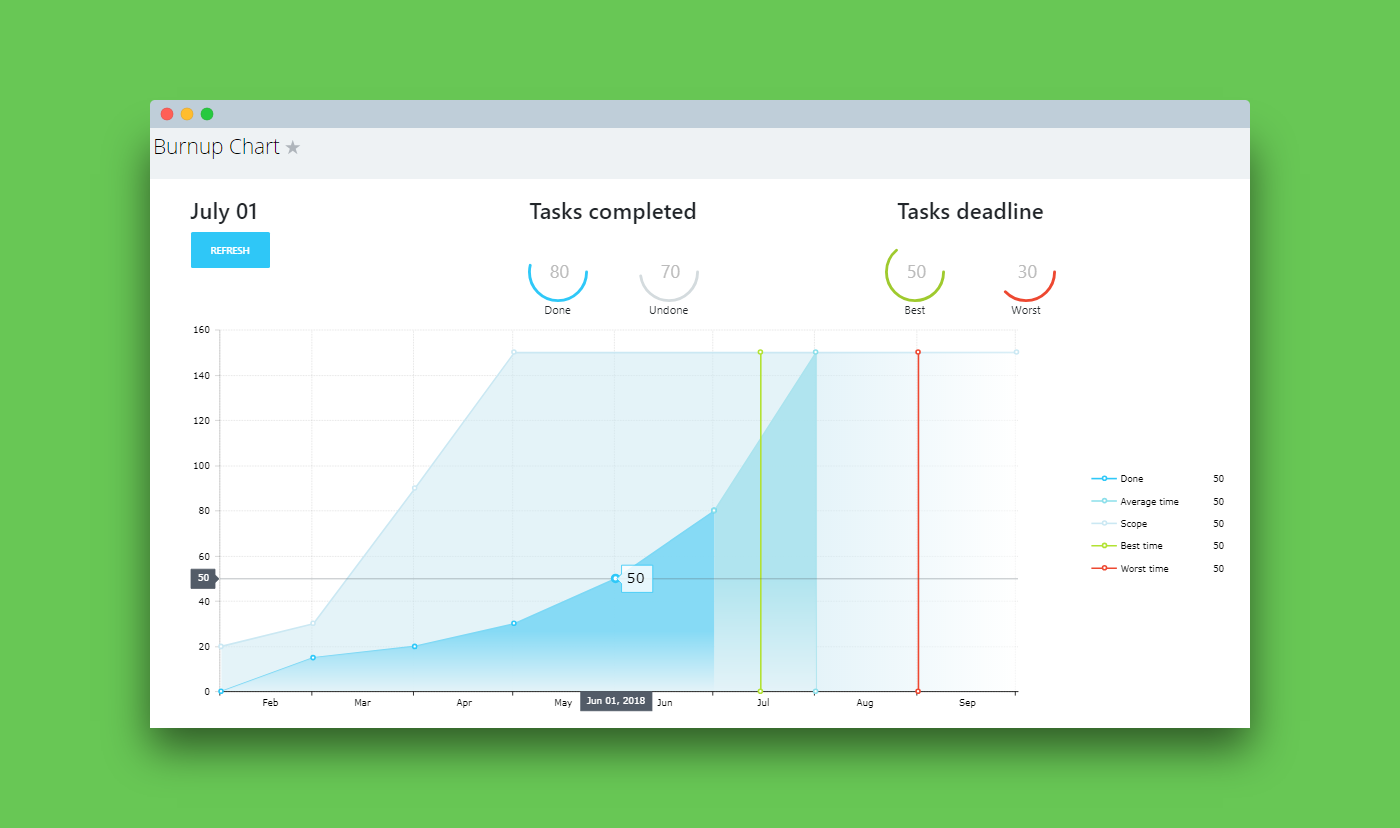
The burnup chart app is designed to track estimated time of project completion. Now, at any moment, you can view estimated time when a project will be completed, if you have appropriate access permissions for this project. The app itself is launched inside a workgroup.
The burnup chart app displays project completion chart, arranged based on a number of tasks at a specified time. If you didn't sel ect a project or selected a project without any tasks, you will see the “overview” chart with demo data.
Chart elements
● X-direction: calendar period that shows how many “Tasks” were completed or will be completed within specified time.
● X-direction: 2 lines in different colors are displayed to show estimated time for project completion.
○ Green line – shows time when the project will be completed faster than an average project completion time.
○ Red line - shows time when the project will be completed slower than an average project completion time.
● Y-direction: indicates the number of tasks that were completed or will be completed within a calendar period, specified in “Date”.
● X- and Y- directions: show provisional graduation lines, allowing to visually split the completion of tasks into time segments.
● Three sectors go through the complete chart. Designations for these sectors can be found in the list of chart symbols.
Additional app elements
● The “Today” date
● The “Refresh” button that updates the chart.
● The “Task completed” diagram shows how many tasks were completed in total and which number of tasks are still yet to be done.
○ Done – completed tasks
○ Undone – tasks in progress.
● The “Task deadline” diagram shows how many tasks are completed relative to deadline.
○ Best – shows tasks, completed before a deadline
○ Worst - shows tasks, completed after a deadline.
● List of symbols used to designate the chart data.
How we calculate end of the project.Formula: (scope / (scope + median)) * project_interval.
● Scope - total number of tasks,
● Median - median deviation from the plan,
● Project_interval - the interval of the project: fr om start to deadline.
Attention! The new version of the app works as a 30-day trial on free Bitrix24 accounts. After upgrading the previous versions, you will need to authorize the application for the second time.


 無料
無料
Data migration has never been so easy! Migrate your data in a few clicks and let the app take care of your data. Few clicks and the migration is complete. Transfer data from Trello to Bitrix24 without extra fuss. Track your migration process.The app shows stages of migration progress. Transfer the archived items.The app will transfer all items, including the archived ones.